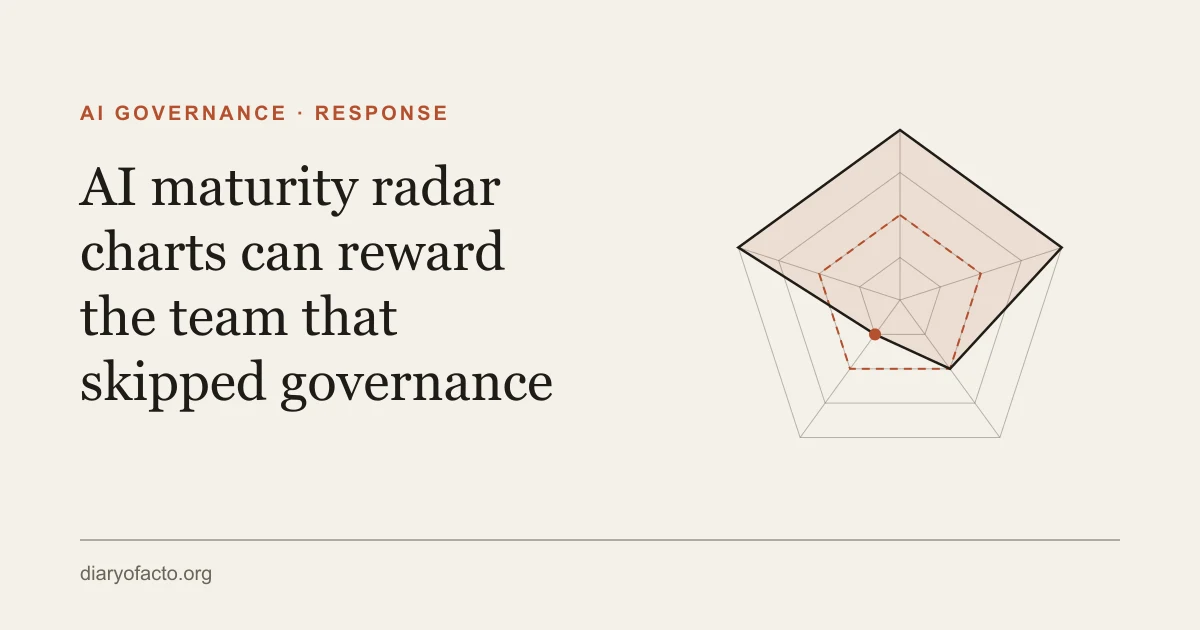
An AI maturity radar chart can give a larger area to a team with reactive governance than to a team that is balanced across every dimension. Ashmita Srivastava proposes a five-dimension AI maturity model in a recent article, and this piece follows one claim from it: that imbalance is the real risk.
Srivastava argues that strong AI results without governance hide risk
Srivastava writes that organizations overinvest in people who build AI and underinvest in integrators, the leaders who tie AI work to business outcomes, measure it and own its risk. To measure that work she built the AIM (AI Maturity) Framework. It scores five dimensions: strategic alignment, operational integration, human capability and adoption, governance and risk management, and impact and value realization. Each dimension has four maturity levels. For governance they run from reactive to proactive risk management. She says she interviewed six enterprise AI leaders. She reports two findings: most tracked use cases, time saved and cost reductions, which she calls activity metrics, and many had no formal plan for when an AI system fails.
She proposes plotting the five scores as a pentagon radar for each team. A larger filled area means broader AI use. She adds that a distorted shape is riskier than a small balanced one, and that organizations with strong results but weak governance and human capability are “just accumulating risk that they cannot see.” Her suggested pipeline collects the data automatically and can block approval of a new AI workflow until a team fixes its variance.
Radar chart area depends on the order of the axes
The area of a radar chart is a sum of triangles. With five axes spaced 72 degrees apart and each score drawn as a radius, the area is one half of sin 72° multiplied by the sum of each score times its neighbor’s score. Each score is multiplied only by the two scores beside it. Move the axes around and the area changes, even though no score has changed.
Take a team that scores 4 on strategic alignment, 4 on operational integration, 2 on human capability, 1 on governance and 4 on impact, using the four levels of the framework. In the order the article lists the dimensions, the neighbor products sum to 46. I checked all 120 orderings of the five axes with a short script. Half of them give 46 and the other half give 40, and no other value occurs. The difference is whether the 2 and the 1 sit next to each other. The axis order is a layout choice, and it moves this team’s area by 15 percent.
A team with reactive governance can outscore a balanced team
Now compare a second team that scores 3 on every dimension. Its neighbor products sum to 45. In the listed order, the first team covers more area than the second, 46 against 45, even though its governance sits at the reactive level and the second team sits at structured governance processes. Both teams have the same average score of 3.0. Reorder the axes and the first team drops to 40, below the balanced team.
So the area metric can rank the riskier team first, and whether it does depends on how someone drew the chart. Srivastava already warns that imbalance is riskier than a small balanced shape. The arithmetic shows why that warning has to be built into the score itself. A reader who looks at area alone, on a dashboard or in a quarterly review, will see the team that skipped governance as the more mature one.
Governance works as a floor because NIST treats it as cross-cutting
The NIST AI Risk Management Framework, NIST AI 100-1, published in January 2023, describes GOVERN as a cross-cutting function designed to inform and be infused throughout the other three functions, Map, Measure and Manage. Under that reading, governance sits underneath the other dimensions. It does not trade off against them on the same scale.
That suggests a different scoring rule. Report three numbers for each team: the lowest dimension score, whether governance clears a set floor, and only then the area. A team below the governance floor is reported as at risk, whatever its area. Srivastava’s own pipeline already points this way, since it can block new AI workflows until variance is fixed. The floor makes that block the headline of the dashboard and stops the area from hiding it.
The same NIST document also gives the governance dimension evidence that is harder to fake than the existence of a board. GOVERN 4.3 asks for practices that enable AI testing, identification of incidents and information sharing. MANAGE 4.3 asks that incidents and errors be communicated to relevant AI actors and that processes for tracking, responding to and recovering from them be followed and documented. Those map directly onto the incident response gap Srivastava found in her interviews. A team clears the floor when it can show a documented AI incident process that has been followed, which is an outcome a governance board alone does not prove.
The floor has limits for small teams and early pilots
A floor has costs. A two-person pilot with no customer exposure does not need structured governance processes to be safe, and a strict floor would block useful experiments. The floor should scale with exposure: low for internal prototypes, high for any AI workflow that touches customers or production decisions. The NIST framework makes a similar point when it says that not all AI risks are the same and that trying to eliminate negative risk entirely can be counterproductive.
The arithmetic also has a limit. The four levels in the framework are ordinal labels, and treating them as radius lengths assumes the gap between reactive and basic compliance equals the gap between structured and proactive. That assumption sits under any area or average computed from these scores. The lowest dimension score avoids most of the problem, because it only needs the levels to be ordered.
Why This Matters for Engineering Leadership
Engineering leaders are being asked to prove AI value, and a single filled shape on a slide is an easy answer to give. Srivastava’s framework is a useful step past activity metrics because it puts governance and human capability on the same page as cost savings. The risk is in how the page gets read. From an AI governance view, the question for any maturity dashboard is whether the weakest dimension is visible without anyone doing arithmetic. Report the floor first, the lowest score second and the area third, and fix the axis order so quarter-to-quarter comparisons mean something.
FAQ
What is the AIM Framework?
Ashmita Srivastava’s AI Maturity Framework scores an organization on five dimensions: strategic alignment, operational integration, human capability and adoption, governance and risk management, and impact and value realization.
Why can a radar chart’s area mislead?
The area of a radar chart depends on which axes sit next to each other. The same five scores can produce different areas when the axes are reordered, so area alone cannot rank teams.
Can an unbalanced team score a larger area than a balanced one?
Yes. A team scoring 4, 4, 2, 1 and 4 in the framework’s listed order covers more area than a team scoring 3 on every axis, even though its governance sits at the lowest level.
What is a governance floor?
It is a minimum governance score that a team or workflow must reach before any other maturity gain counts. Below the floor, the team is reported as at risk regardless of its area.
How does the NIST AI RMF treat governance?
NIST AI 100-1, published in January 2023, describes GOVERN as a cross-cutting function designed to inform and be infused throughout the Map, Measure and Manage functions.
Does this replace the radar chart?
No. The chart stays useful as a picture. The proposal is to report the lowest dimension score and the governance floor beside it, so the picture cannot hide the weakest axis.